Visualizing Policing and Health Data in Virtual Reality
This interdisciplinary research is motivated by the impact that VR data visualization could have on data-driven social science research. We have developed a VR application that explores the relationship between police tactics and EMS mental health data obtained from NYC government data sources. The application visualizes data on a stack of 3D map data slices and uses a direct-manipulation interaction technique to allow users to explore the relationships between data slices. Users can grab, move, and snap data slices, and customize their spatial layout for data comparison.
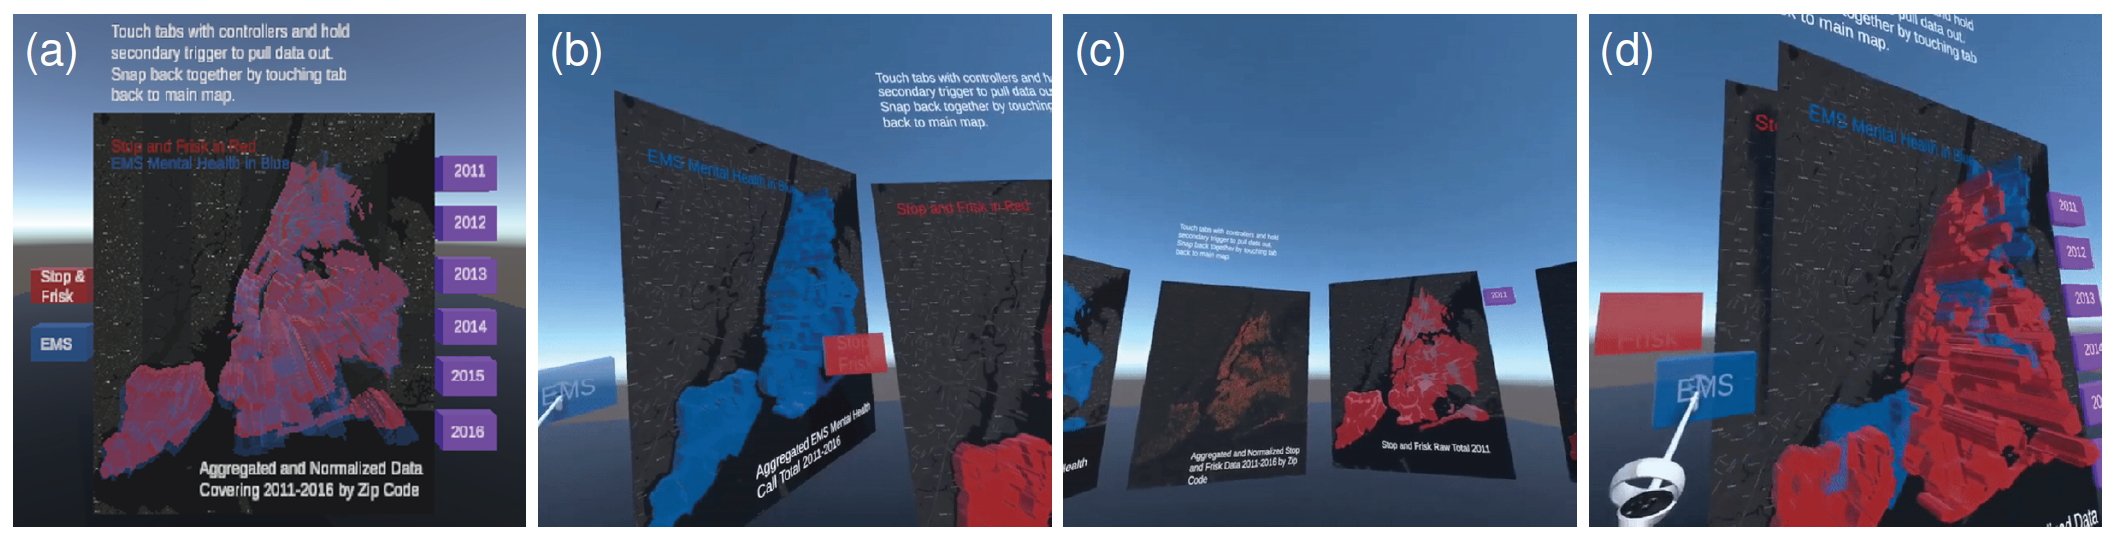
3D map stack with tabs to grab, move, and snap. (a) Default position with all data slices in stack. (b) User grabs and moves
EMS data slice apart from stack. (c) Customized spatial layout of data slices. (d) User snaps EMS data slice back in stack.
We explore the potential impact of virtual reality (VR) data visualization on social science research.
Our use case is inspired by social science literature [13, 15] that highlights the correlation between increased policing presence and negative mental health in community neighborhoods.
Using New York City (NYC) public data sources, our analysis shows yearly stop-and-frisk (SF) incidents with yearly emergency medical services (EMS) mental-health--related calls.
We incorporate the data sets with our VR data interaction design to enable users to explore the data sets in a visual and tangible manner in a Virtual Environment, to try to understand the impact of the underlying societal problem.
Post-processed data sets related to the visualization topic are imported along with geo-coordinate data to generate 3D geographical data slices.
Each data slice visualizes a selected subset from public open data: EMS [1], SF, and SF by year [9].
The data slices contain information related to the targeted societal problem. A user can grab a data slice by its tab to manipulate it in space and within its data set.
If the user wants to see the raw SF counts for year 2011, they can locate the 2011 tab and pull it out of the main display. As shown in the figure (c), if they want to see the total EMS data for all years,
they can pull out the EMS data tab, view a new map of that data slice and watch the primary display dynamically update to remove that data.
Implementation
Our system is implemented in Unity 2019.4.23f1 for Oculus Quest.
It contains a 3D map stack that represents all data slices in the system.
A combination of semi-transparent differently colored extrusions make different data types discernible.
Around the map are color-coded tabs that correspond to specific data slices, with text labels and instructions, as shown in the figure (a).
The main map view dynamically updates to the current data input state as slices are removed from and snapped into it.
When a single data slice is moved from the main map view to another location, the single data slice view shows only data related to that slice, as shown in the figure (b).
Individual data slices can be spatially positioned at the user's discretion to create data views and comparisons, as shown in the figure (c).
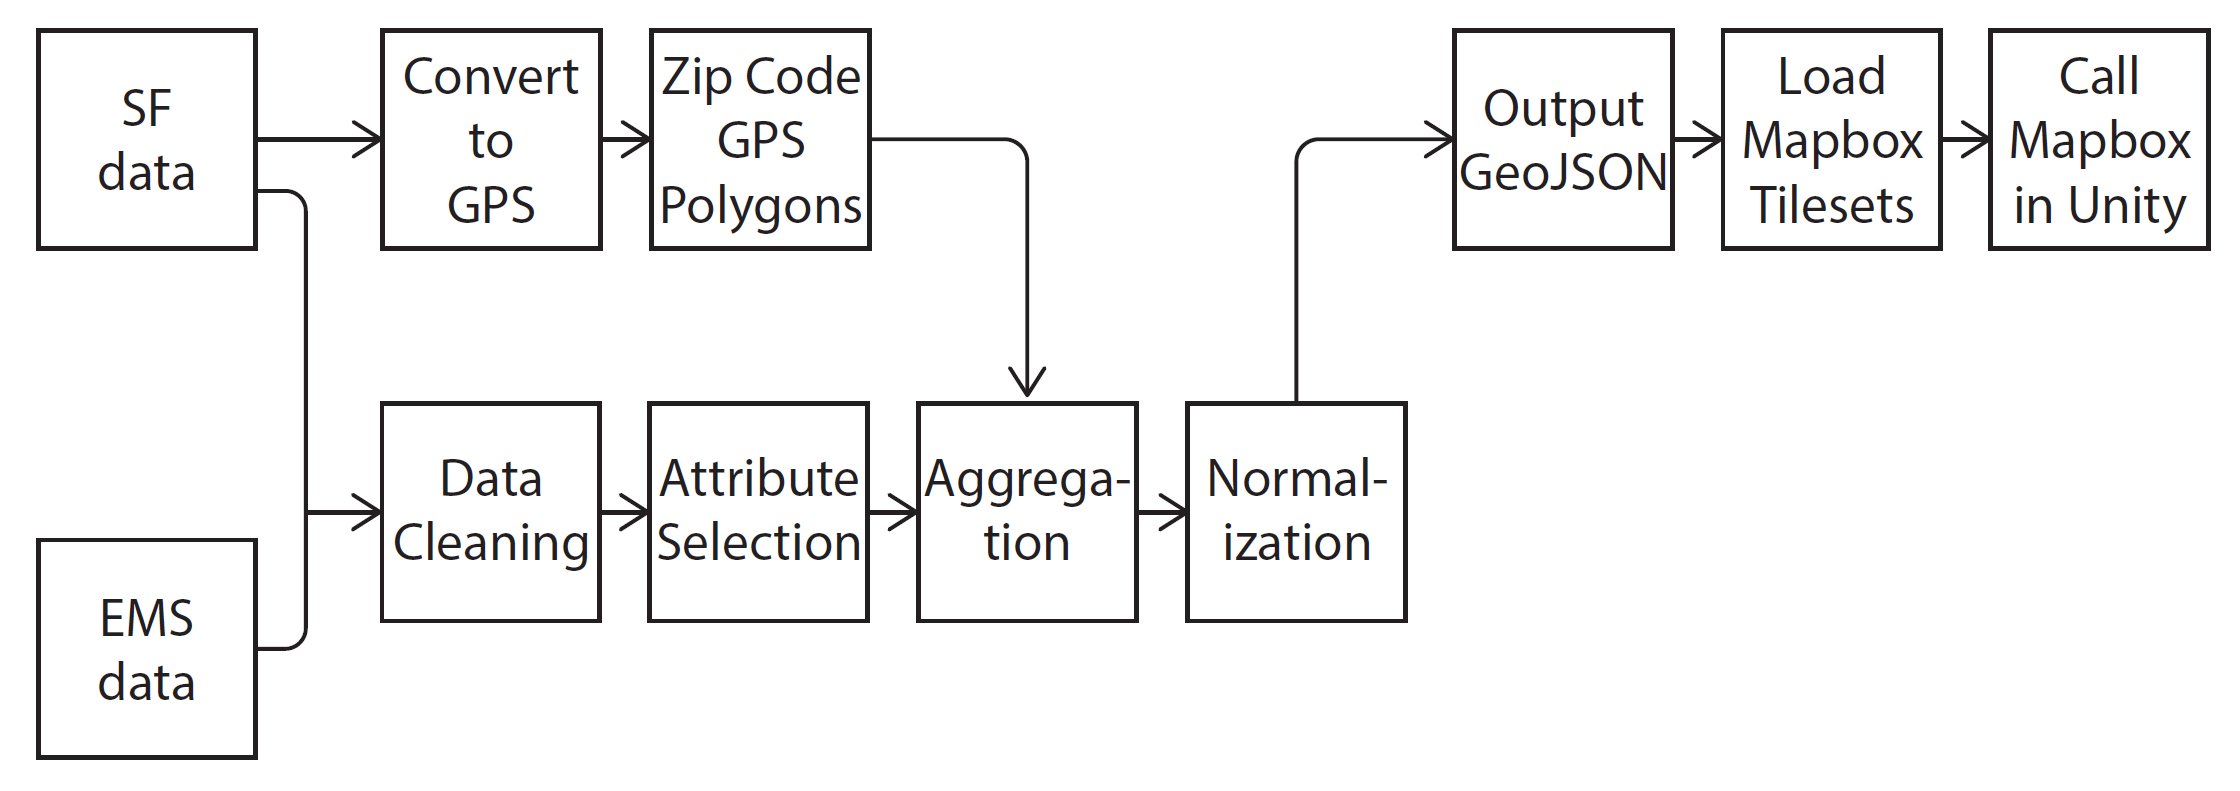
Our data is sourced from NYC Open Data [4]. The active stop-and-frisk program was discontinued in 2017, so we selected 2011--2016 as our target years to consider, from which we use SF data [9] and EMS data [1]. The diagram illustrates the overall data processing flow. To prepare the data, we first cleaned and analyzed the data sets using the 2D data analysis tool Tableau. We converted all data point locations to EPSG:4326---world geodetic coordinate system 84 coordinates (commonly used for GPS coordinates). We then used open-source NYC zip-code coordinates obtained from
Open Source Delaware [6] to define polygons that represent the NYC zip codes. Next, we used the software QGIS [7] to aggregate the stop-and-frisk incidents by zip code and export that data with the EMS data to GeoJSON files. We also normalized the data on a per-year basis, as well as by all years combined.
Our virtual environment displays maps of the five boroughs of NYC, created using Unity and Mapbox. We feed our GeoJSON files into Mapbox to create tile sets that can be called from the Mapbox API. In Unity, we generate maps of NYC with the Mapbox SDK and call their API to pull down the zip-code polygons onto the map. We then use the Mapbox API to extrude polyhedra from the polygonal zip code shapes that represent the EMS and SF data using height and color.
Interaction Design
To interact with the displayed data, the user can use the controller grip triggers to grab tabs around the primary map, as shown in the figure (a). Once grabbed, data slices can be pulled away from the main map stack and will be displayed on newly generated maps, as shown in the figure (b). As data is removed and replaced in the main map, it will dynamically update to represent the current state of the data. If all data slices are removed, an underlying 2D heat map is revealed that shows detailed stop-and-frisk incident locations, as shown in the center of the figure (c).
On the left side of the base map, the user will find EMS and SF data slices covering the total aggregated years. As these slices are removed, the main map will dynamically update to represent only the data still attached. On the right side of the base map, the user will find yearly data slices of SF data. These allow the user to see a representation of raw totals of incidents over the years, in effect seeing how policy changes are correlated with reported incidents. To remove the generated maps, the user can drop them back into the main map, as shown in the figure (d). As the left-side tabs are placed back into the main map, its display will update to include the data slices from the dropped map.
As the user moves virtually with the Oculus controller joysticks, we use field-of-view restriction, implemented with VR Tunneling Pro [8] to reduce VR sickness.
To allow users to perform interactions at a distance, we implemented a variant of the Go-Go hand [14], initiated by holding down the index trigger on a controller. In this mode, if the controller is close to the user’s head position, the virtual hand will coincide with the controller. As the user moves the controller away, the virtual hand will extend nonlinearly beyond the controller.
References
[1] EMS Incident Dispatch Data | NYC Open Data -
https://data.cityofnewyork.us/Public-Safety/EMS-Incident-Dispatch-
Data/76xm-jjuj.
[2] GeoJSON-a format for encoding a variety of geographic data structures
- https://geojson.org.
[3] Mapbox-Maps, geocoding, and navigation APIs SDKs -
https://www.mapbox.com.
[4] NYC Open Data - https://opendata.cityofnewyork.us/.
[5] Oculus Quest - https://www.oculus.com/quest-2/.
[6] Open Source Delaware - state boundaries - USA -
https://github.com/OpenDataDE.
[7] QGIS-A Free and Open Source Geographic Information System -
https://www.qgis.org.
[8] SIGTRAP Games | VR Tunnelling Pro -
http://www.sigtrapgames.com/vrtp/.
[9] Stop, question and frisk data Reports | NYC Open Data
- https://data.cityofnewyork.us/Public-Safety/The-Stop-Question-and-
Frisk-Data/ftxv-d5ix.
[10] Tableau-Business Intelligence and Analytics Software -
https://www.tableau.com.
[11] Unity - https://unity.com/developer-tools.
[12] Laksono, Dany and Aditya, Trias. Utilizing A Game Engine for Interac-
tive 3D Topographic Data Visualization. ISPRS International Journal
of Geo-Information, 8(8):361, Aug. 2019. doi: 10.3390/ijgi8080361
[13] H. Oh, C. D. Cogburn, D. Anglin, E. Lukens, and J. DeVylder. Major
discriminatory events and risk for psychotic experiences among Black
Americans. American Journal of Orthopsychiatry, 86(3):277–285,
2016. doi: 10.1037/ort0000158
[14] I. Poupyrev, M. Billinghurst, S. Weghorst, and T. Ichikawa. The go-
go interaction technique: non-linear mapping for direct manipulation
in VR. In Proceedings of the 9th annual ACM symposium on User
interface software and technology - UIST ’96, pp. 79–80. ACM Press,
Seattle, Washington, United States, 1996. doi: 10.1145/237091.237102
[15] A. A. Sewell, K. A. Jefferson, and H. Lee. Living under surveillance:
Gender, psychological distress, and stop-question-and-frisk policing in
New York City. Social Science & Medicine, 159:1–13, June 2016. doi:
10.1016/j.socscimed.2016.04.024
[16] M. Spur and V. Tourre. Evaluation of Spatial Data Layer Compositing
Techniques in Interactive VR Environments.
CollaboratorsYuanyang Teng, Jacob Alexander, Courtney Cogburn, Steven Feiner
 3D map stack with tabs to grab, move, and snap. (a) Default position with all data slices in stack. (b) User grabs and moves
EMS data slice apart from stack. (c) Customized spatial layout of data slices. (d) User snaps EMS data slice back in stack.
3D map stack with tabs to grab, move, and snap. (a) Default position with all data slices in stack. (b) User grabs and moves
EMS data slice apart from stack. (c) Customized spatial layout of data slices. (d) User snaps EMS data slice back in stack.